Well as some of you may know, I had the car at the dyno. today to see what it was making with the addition of the new turbo & intake manifold.
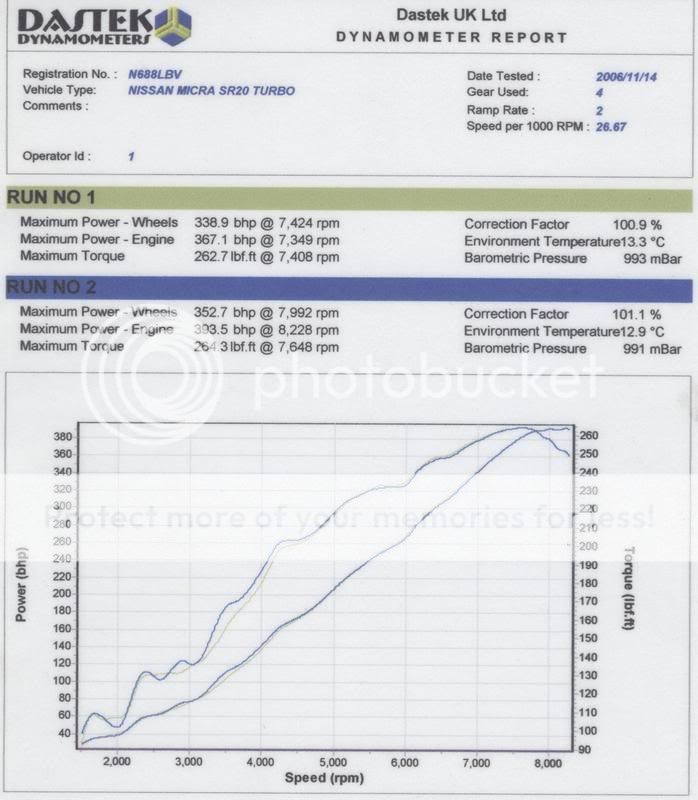
Intial results are quite good at 393.5 BHP at just 10 psi, but the weird thing was where it made the peak power...right on the rev limiter at 8228 rpm!!!
The engine now needs mapped, as it was running lean (about 14.5) from pretty much idle to 6000 rpm, hence the much lower torque figures.
However, regardless of the results, it shows that there is plenty more to come.
With the lean running issue, is is doubtful that I will get up to Knockhill this Sunday(sorry for those who wanted a shot), but I'm sure you can understand that it is not worth risking the engine!
Here's the dyno. graph...

Cheers
Dave
P.S. There were 2 runs as the operator didn't want to rev the engine as high as 8200 rpm on the first run...LOL!!!
Intial results are quite good at 393.5 BHP at just 10 psi, but the weird thing was where it made the peak power...right on the rev limiter at 8228 rpm!!!
The engine now needs mapped, as it was running lean (about 14.5) from pretty much idle to 6000 rpm, hence the much lower torque figures.
However, regardless of the results, it shows that there is plenty more to come.
With the lean running issue, is is doubtful that I will get up to Knockhill this Sunday(sorry for those who wanted a shot), but I'm sure you can understand that it is not worth risking the engine!
Here's the dyno. graph...

Cheers
Dave
P.S. There were 2 runs as the operator didn't want to rev the engine as high as 8200 rpm on the first run...LOL!!!
